Reverse Engineering Chlor-Alkali Unit Economics | Chapter 1: The Stasis
As much as one may be interested in the $50bn chlor-alkali industry, which produces caustic soda, a chemical critical for alumina refining, soap & paper industry, wastewater treatment, desalination, pharmaceuticals and more, one will find it an expensive challenge to find data and understand the inner economic workings of this industry.
No chlor-alkali plant operator is open to discussing the market price or the unit economics. I’ve talked to several. And I’m not paying $6000 to a consulting firm for an analysis and data.
The market price of caustic soda (NaOH) is $450-700/ton. What is the production cost? There’s no clear answer to this, and even LLMs are not useful. So, I had to reverse engineer the chlor-alkali unit economics. This is part one.
A quick ChatGPT query to pull up the reported cost of a chlor-alkali plant and its production capacity is a good starting point. Here’s what it says:
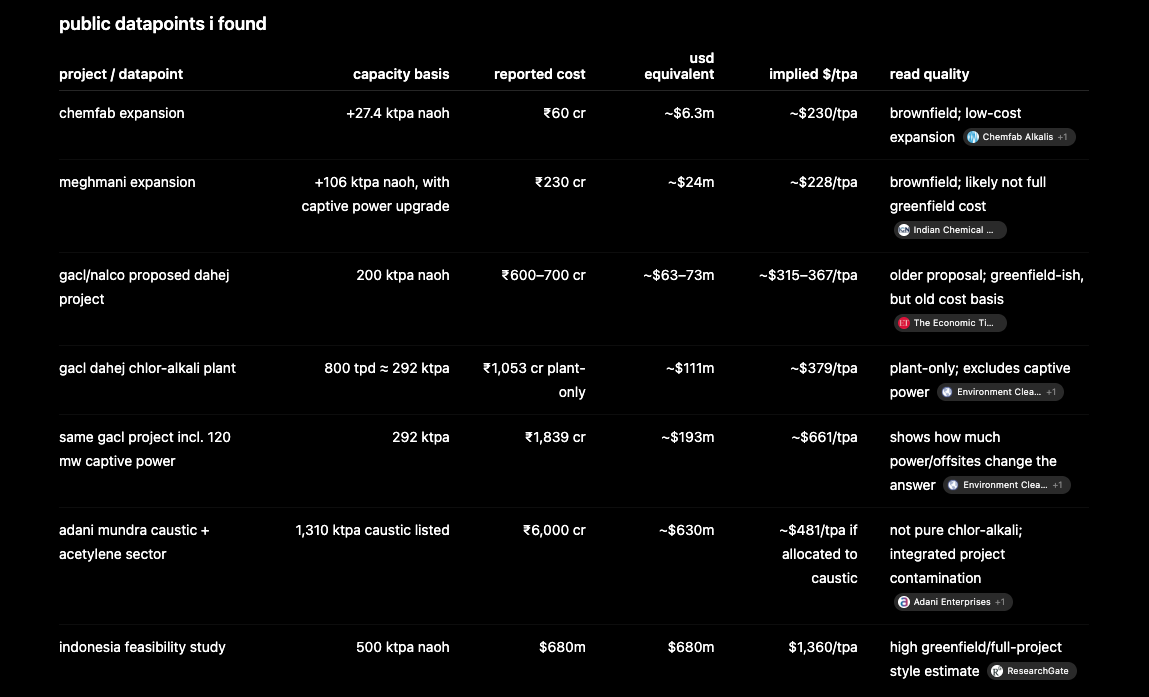
How far can we go with this data? Surprise, surprise, it gives us a lot. (tpa is tons per annum.)
Let’s assume a few things.
- Cost of electricity = $60/MWh (the cheapest industrial grid price in the US)
- Yield of NaOH = 2.5 MWh/ton-NaOH
- Lifetime of plant = 10 years (I got this from a chlor-alkali plant operator)
- Non-electric operating cost = $169/ton-NaOH (salt, steam, membranes, labor, maintenance, overheads. I built this up line by line from the European BAT reference document for chlor-alkali.)
Now, digging in…
What is the plant’s CAPEX per ton-NaOH per year? The $/tpa?
This is straightforward.
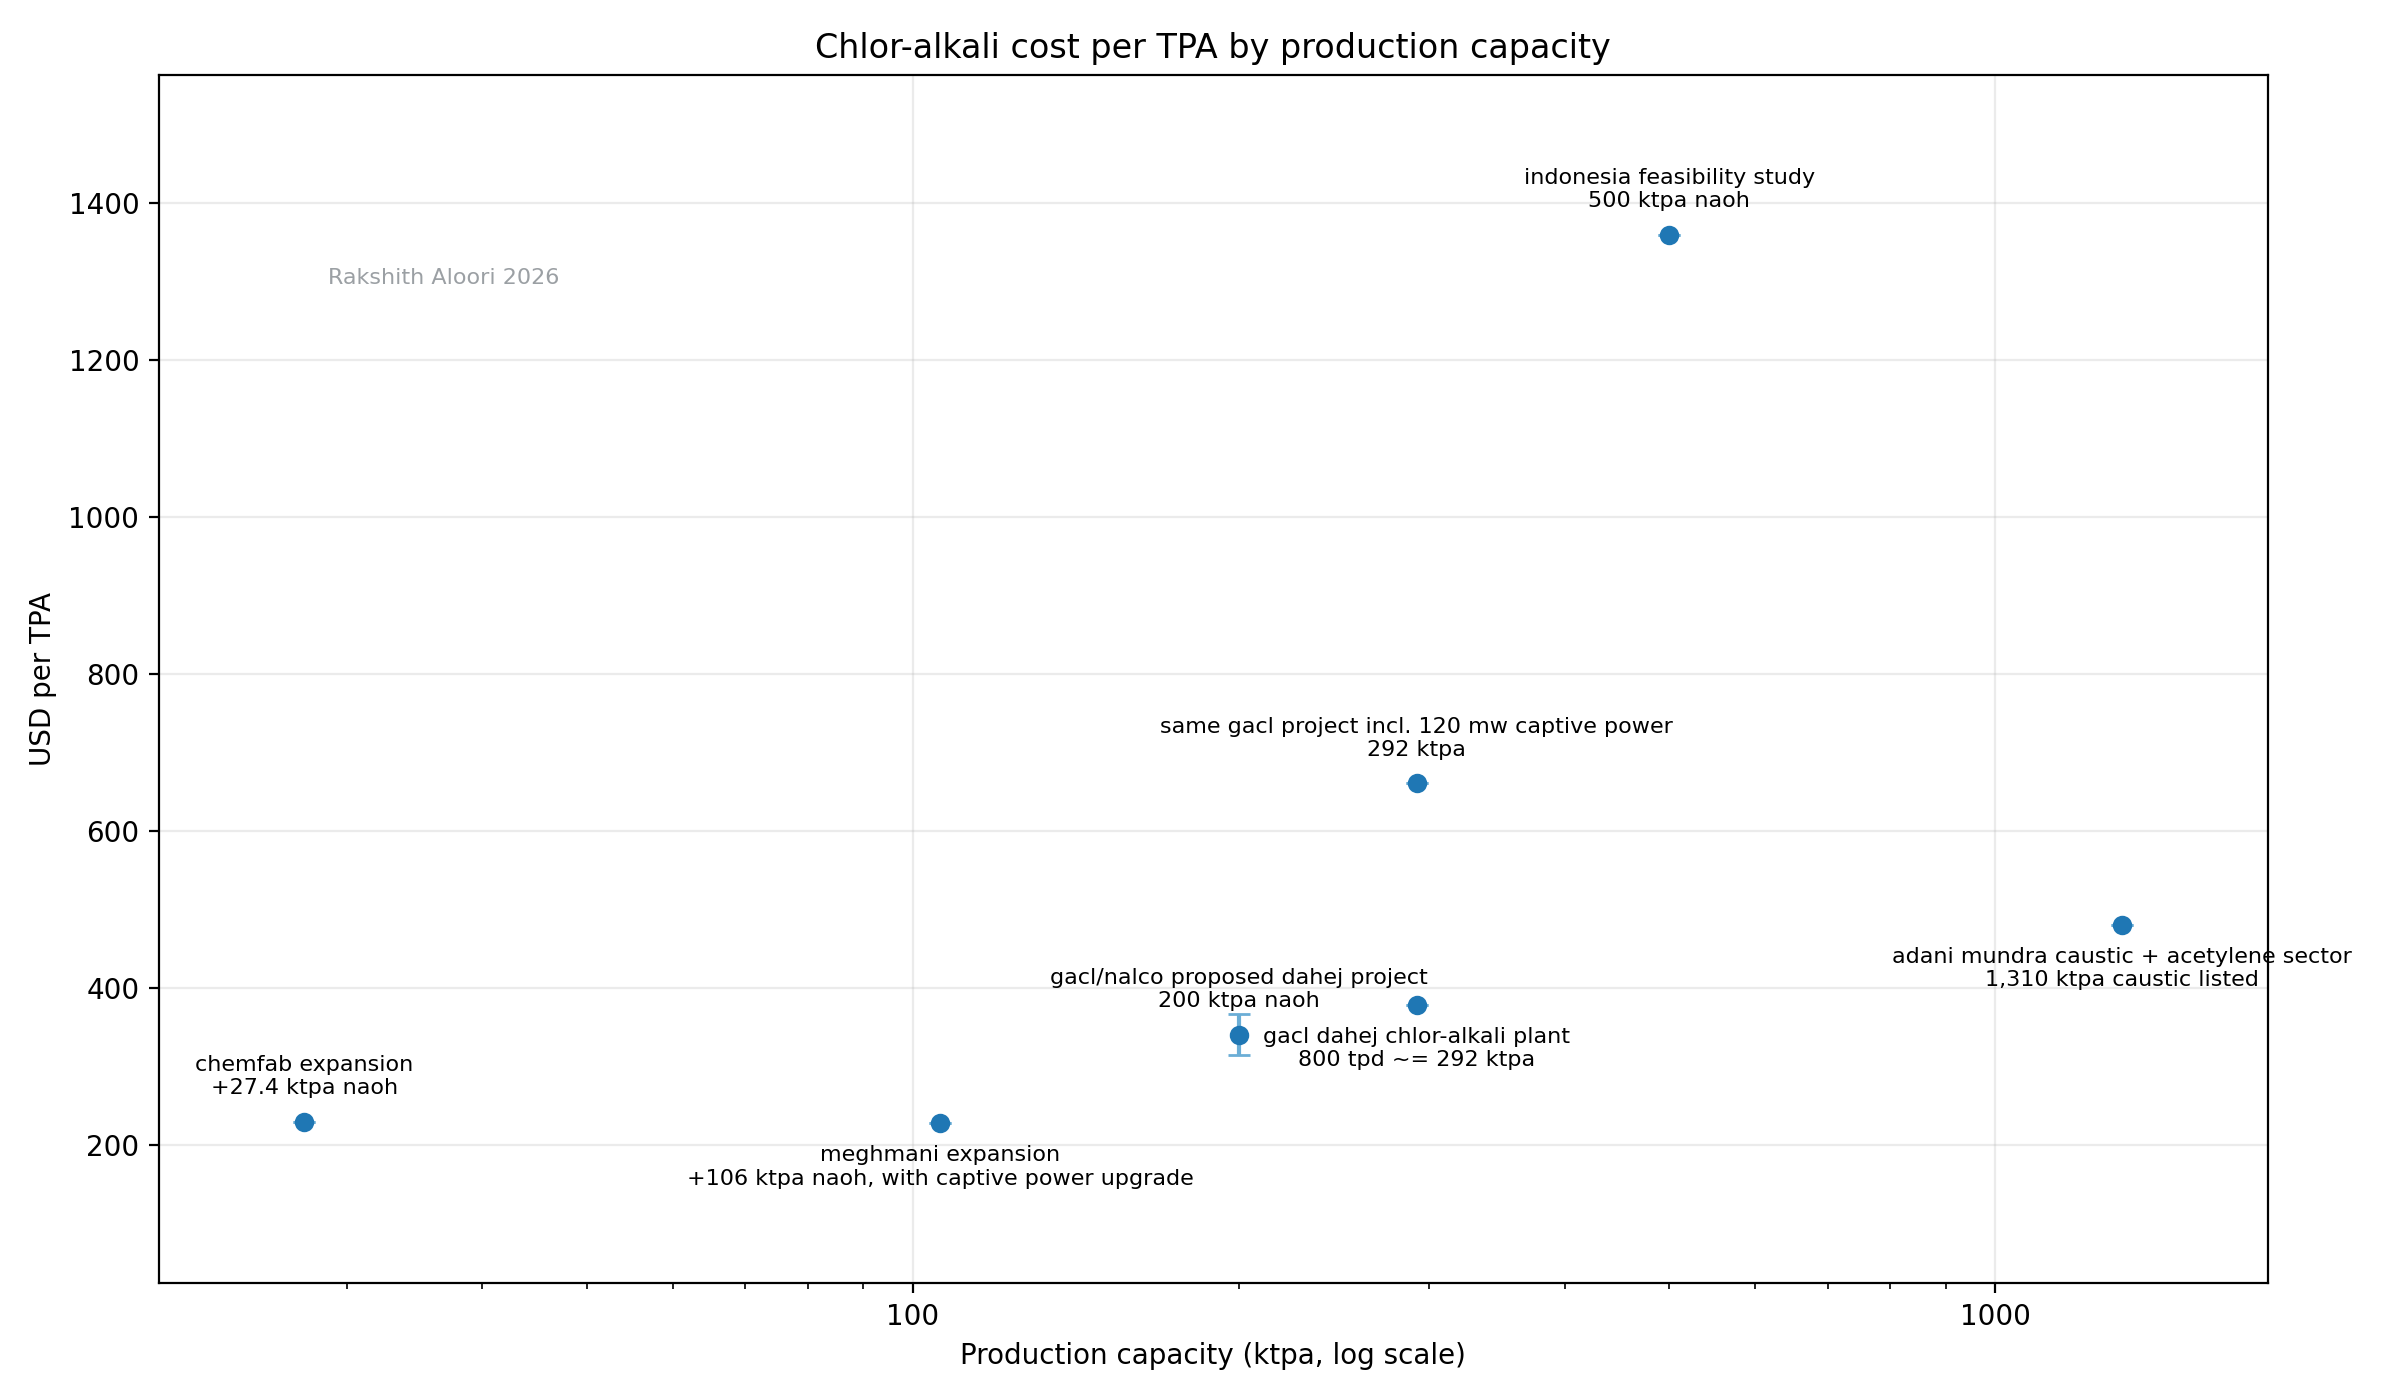
The points split by project type, but the overall direction is still clear: reported $/tpa goes up with capacity. The points don’t just show economies of scale. They slope the other way. $/tpa increases as production capacity increases (!!). Chlor-alkali plants do not have any production scale advantage. In fact, they exhibit diseconomies of scale.
The smallest project, Chemfab’s 27.4 ktpa expansion, costs around $290/tpa. The largest, the 500 ktpa Indonesian feasibility study, costs around $1400/tpa. The Western conversions and newbuilds are even more expensive, reaching nearly $1900/tpa.
Bigger chlor-alkali projects are not cheaper per unit of capacity. They are more expensive. Notice how the $/tpa climbs as we move from Egyptian Petrochem to GACL Dahej to Westlake.
The absence of a visible scale advantage is surprising. There is nothing in this data suggesting that a small plant must have a worse capital cost per ton than a large one. That entertains smaller plants built closer to NaOH consumers, avoiding the cost of transportation and storage.
Moving on.
What is the plant’s load CAPEX/kW? The $/kW-load?
What is the production cost of NaOH/ton? The $/ton-NaOH?
I used to set that last term to zero and look only at capital and power. That was too generous. Salt, the steam to concentrate 32% cell liquor up to merchant-grade 50% caustic, membranes and gaskets, maintenance, labor, overheads, insurance. All of it is real, and it adds up to ~$169/ton before you buy a single kWh.
One caveat. The fixed lines in that $169 come from a 500 ktpa plant, so reusing the same number for the small expansions flatters them. Real small-plant labor and overhead per ton are higher.
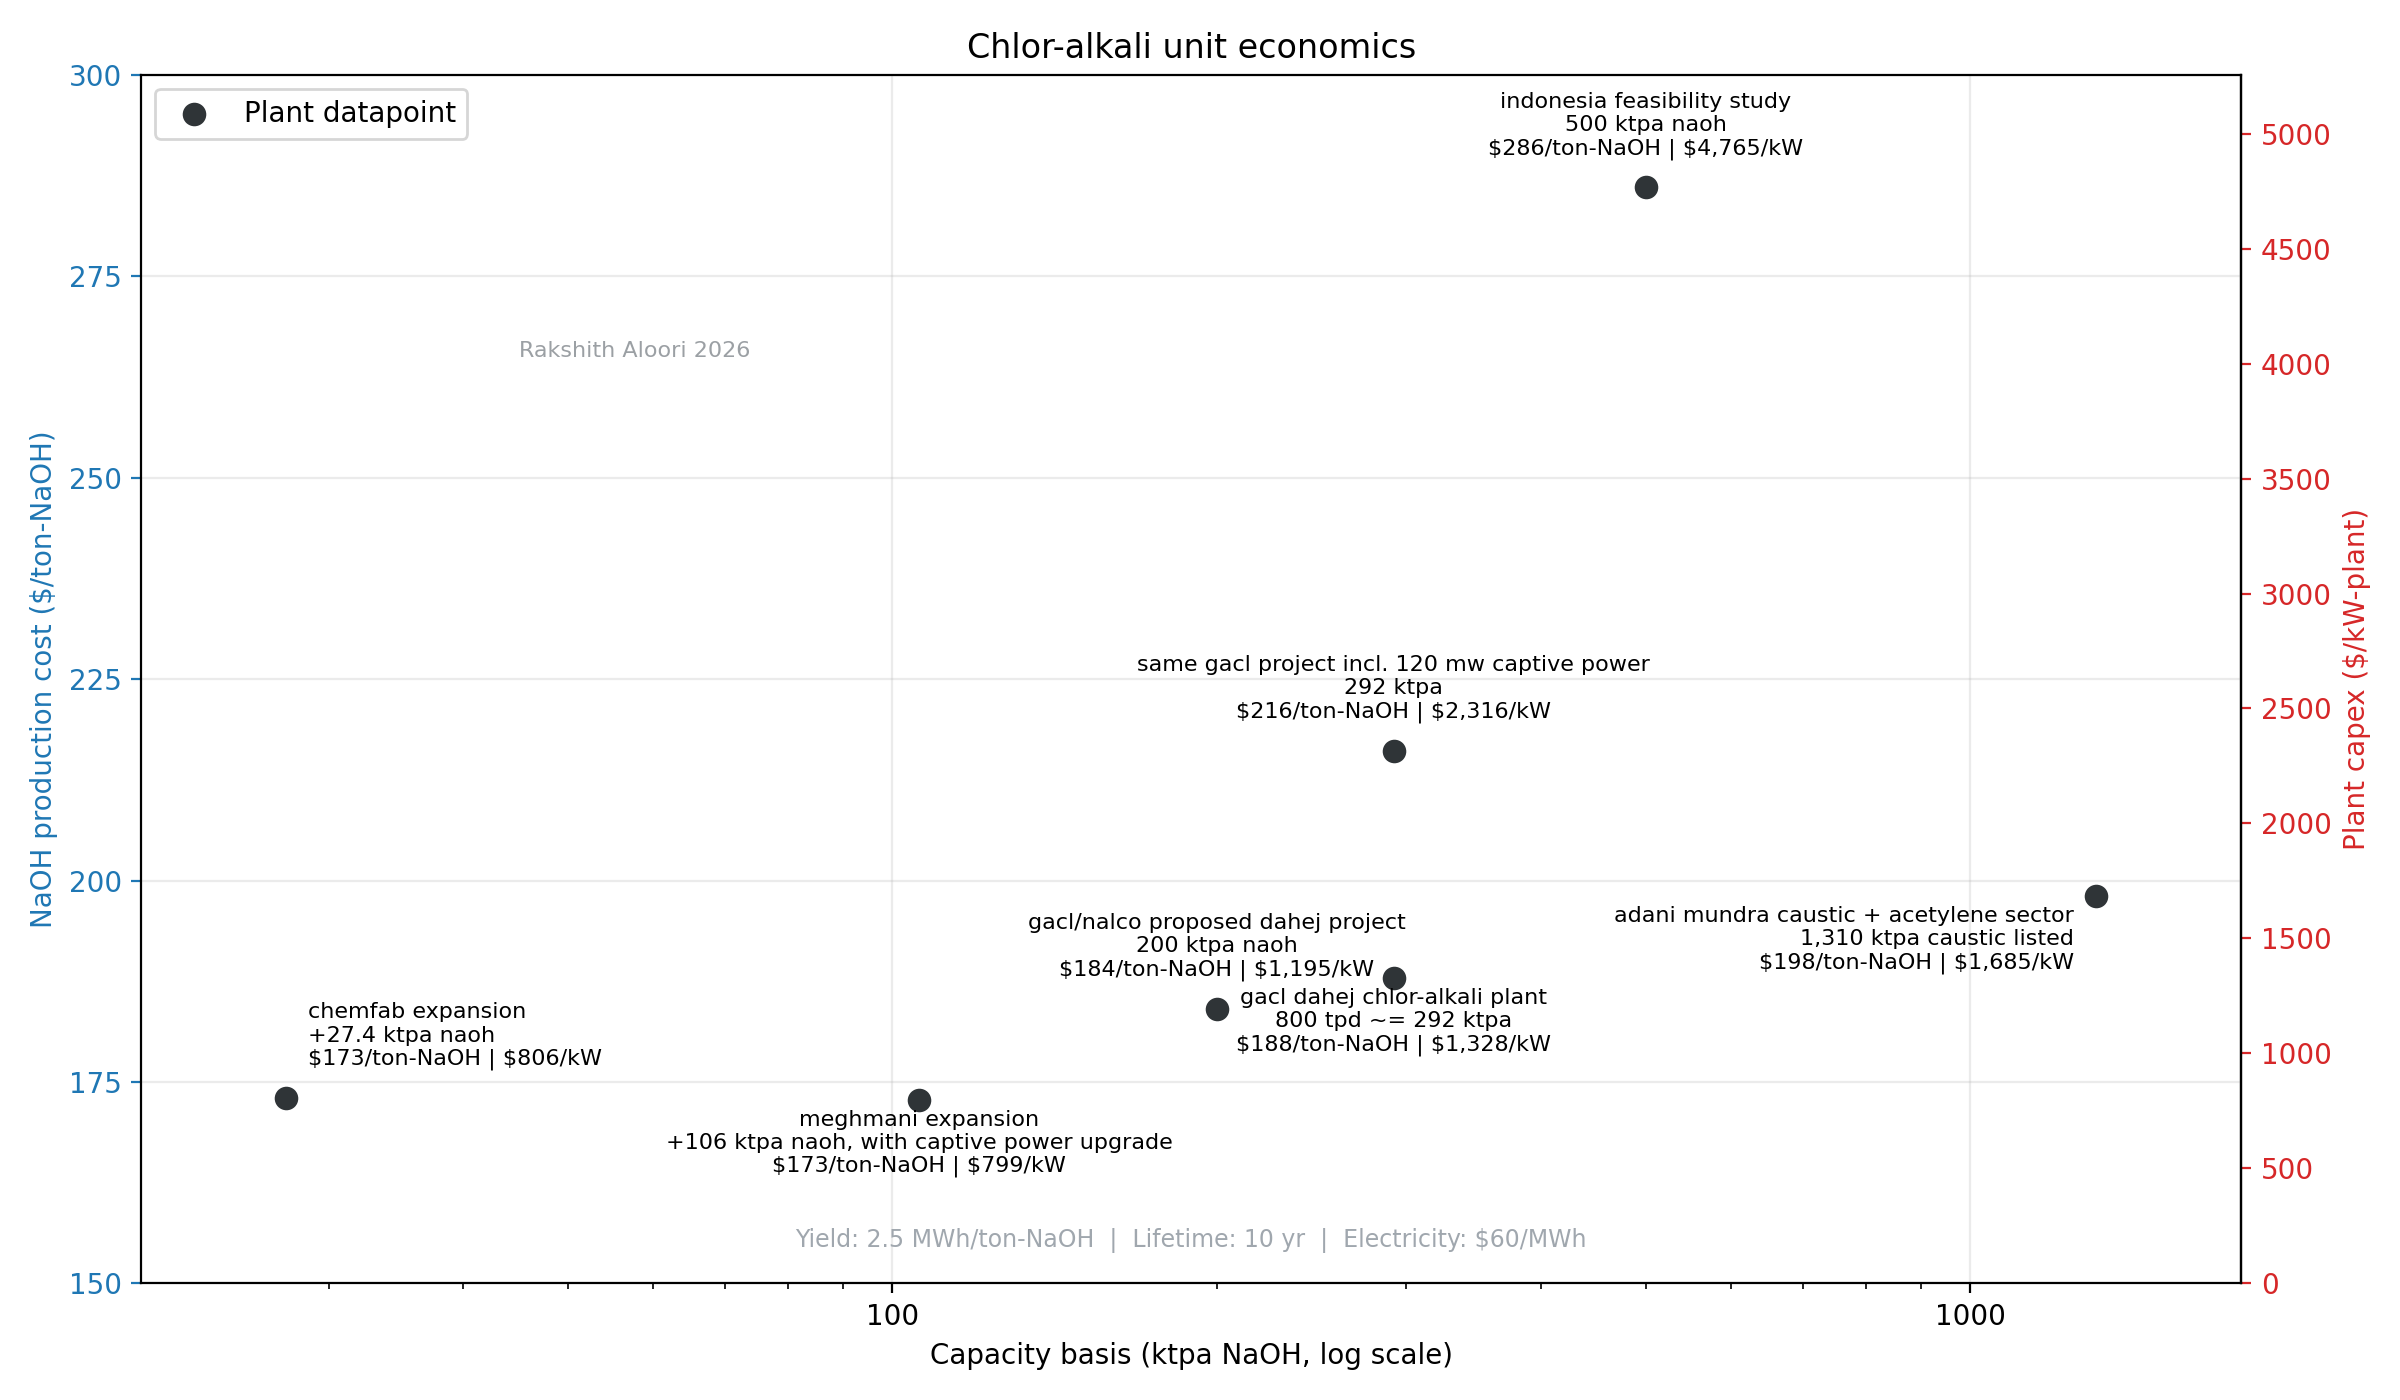
These are the key unit economics numbers. The $/kW-load tells us the cost of the plant based on the power input. The $/ton-NaOH tells us how expensive the caustic soda is to make and how much margin you can make at a certain market price.
Production cost lands between $414 and $500/ton here. Market price is $450-700/ton. So there is a margin, but it is thin, and the most expensive plants are underwater whenever caustic sells at the bottom of that range.
The load CAPEX / kW for isn’t one range either. It is two clusters. The Indian projects sit at $1100-$2300/kW. The Western newbuilds and conversions (Westlake, Covestro, Cape Igarassu) and the Indonesian study sit at $3700-$6300/kW. Same chemistry, 3-6x the CAPEX. Whichever cluster you think you’re in, that number has some interesting implications for whether you need batteries if you want to use a solar/batteries play—more on this in part two.